GUIDE:
- Getting Started
- Detailed Reports
- Reading Campaign Dashboards
- Campaign PDF Reports
- Pivot Reports
- API Reporting
- My Organization Dashboard
- Performance Graph on Ad Group Edit Form
- Additional Reporting Available
Getting Started
Within Choozle, you have several opportunities to generate and save reports on the results of your Web Insights and campaigns.
Detailed Reports
The demand for marketers to showcase campaign performance is higher than ever, and Choozle is meeting this demand with the Detailed Reports feature. Detailed Reports provides expanded reporting across many key data points, such as creative, sites, geolocation, browser, device type, etc. that streamline campaign optimization.
Viewable within the ‘Action’ button on campaigns and ad groups, these reports are accessible on the campaign and ad group levels. Each of the reports will be similar in data points; however, the ad group report will be exclusive to the ad group you are selecting.
Below is an overview of the charts and data points that will be available across Detailed Reports.
|
Campaign Overview |
|
|
|
Campaign Details |
|
|
|
Ad Group Overview |
|
|
|
Ad Group Details |
|
|
Detailed Reports can quickly and easily inform optimization decisions for your campaigns. Instead of waiting for reports to download, users can now toggle between the Campaigns Dashboard and the Detailed Reports for in-depth, real-time data. Users can see data from top-performing website lists, geolocation heat maps, creative performance bar graphs, and more. Detailed Reports allows you to export individual data tiles as a PDF, CSV, or PNG. Platform operators can also schedule their own reports to be sent via email monthly, weekly, daily, hourly, or by the minute.
Operators can also schedule alerts when a certain value “Is greater than,” “Is less than,” “Is equal to,” “ Is greater than or equal to,” “Is less than or equal to,” “Increases by,” “Decreases by” and lastly, “Changes by” an input value. For example, we can schedule an alert to be sent when our win rate is less than or equal to 15%.
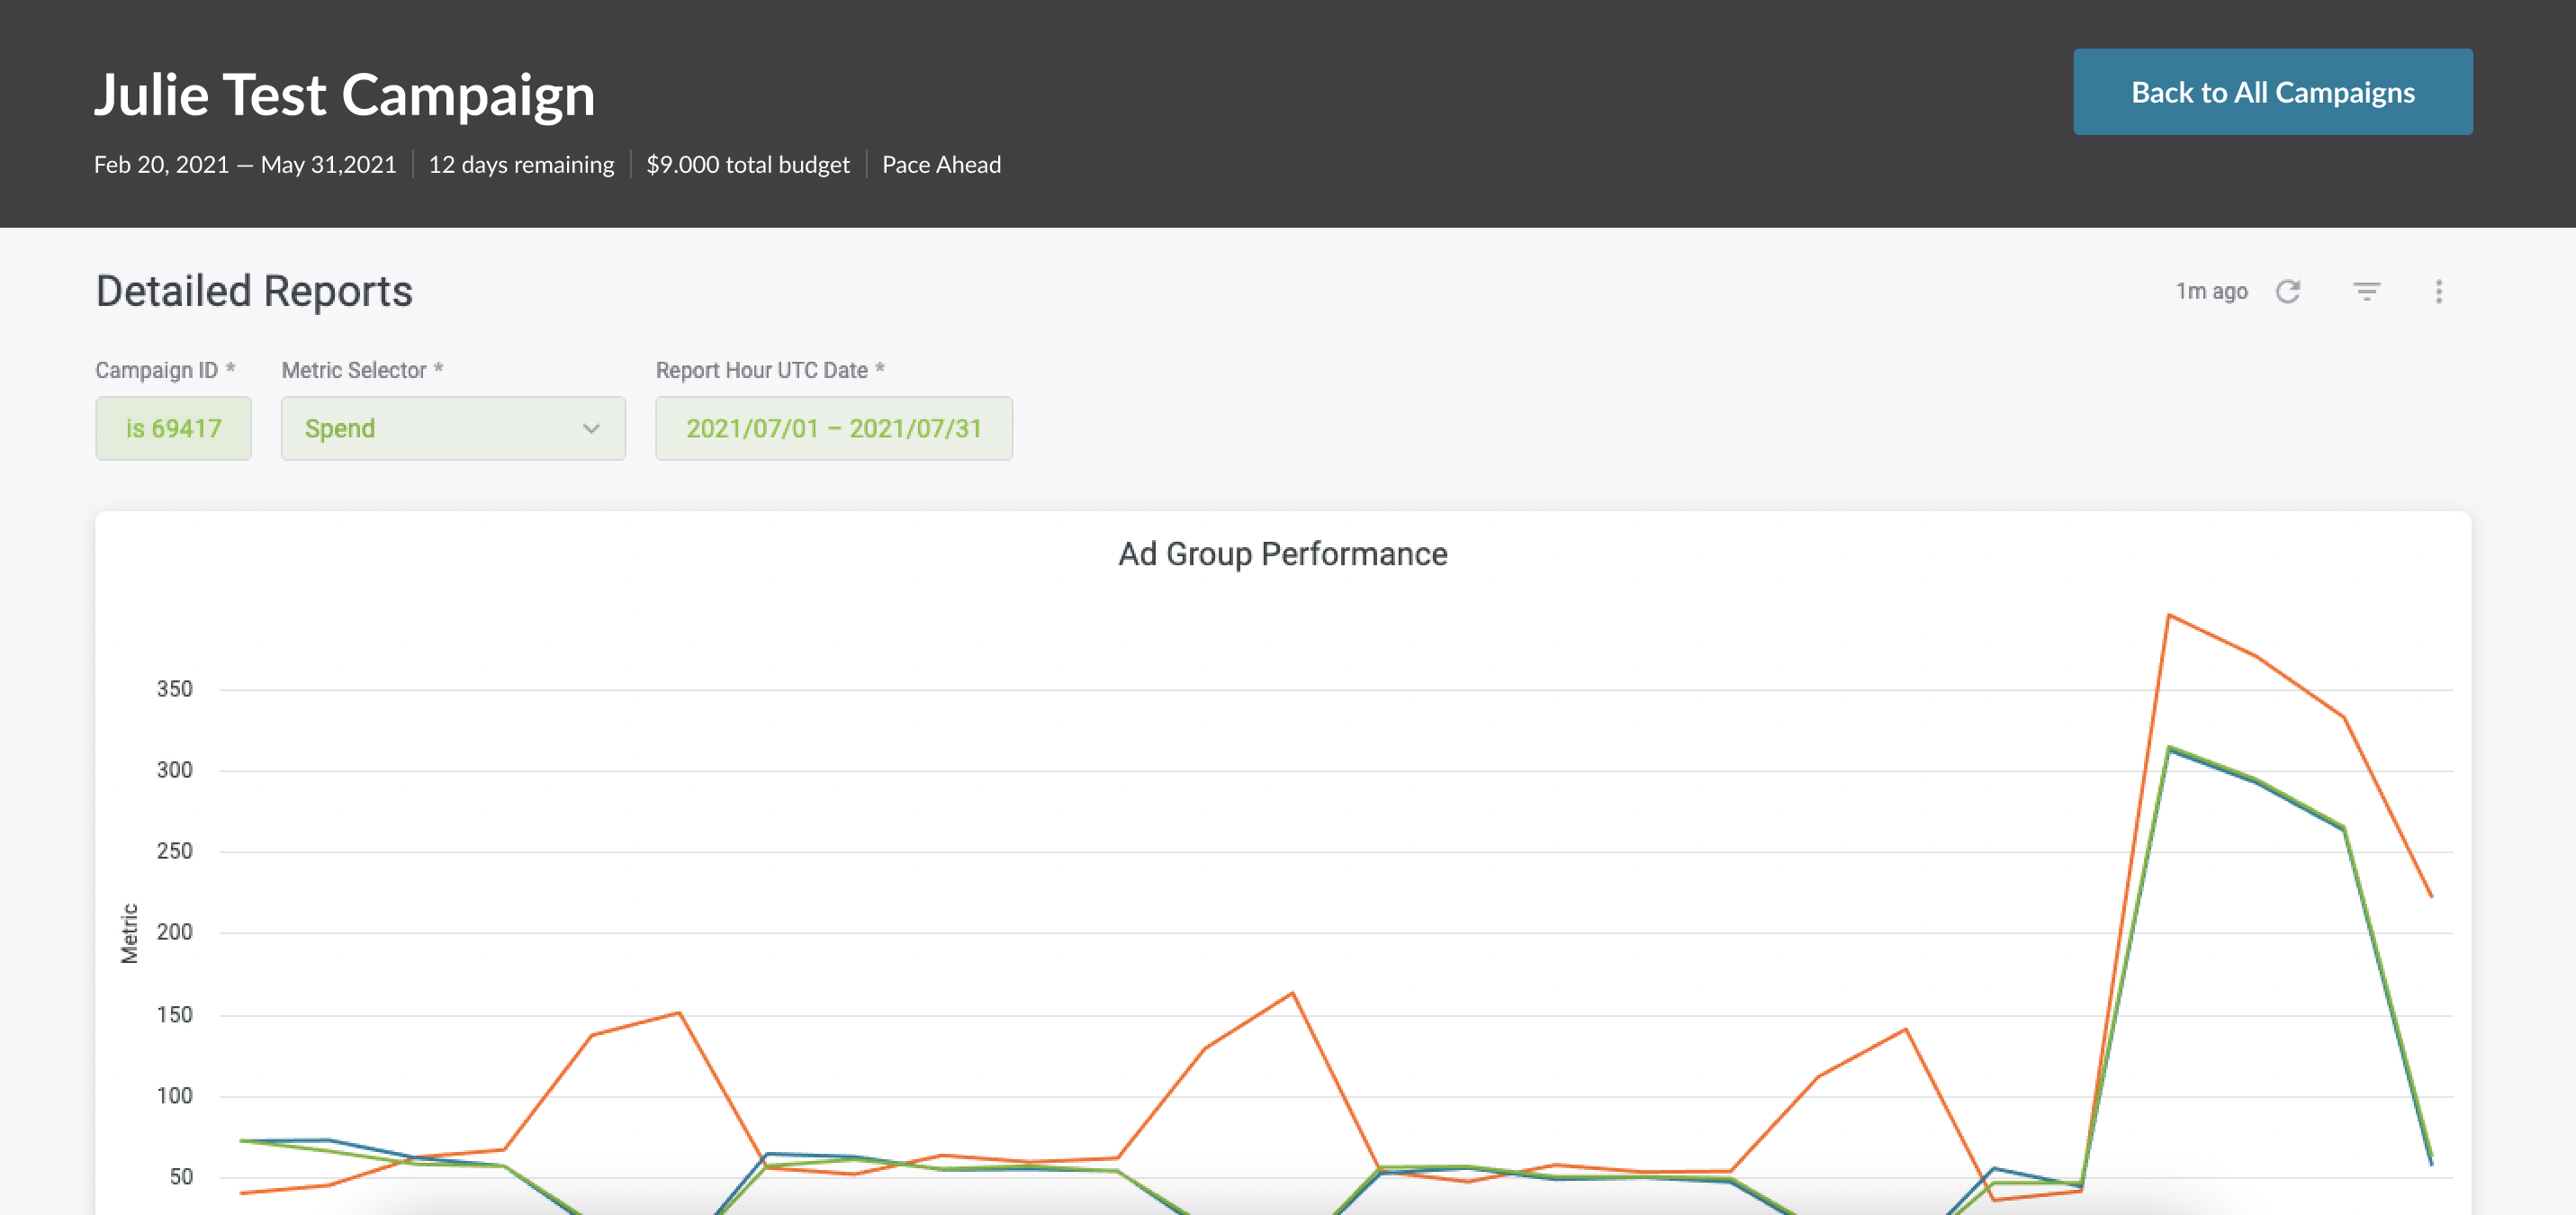
Reading Campaign Dashboards
In addition to the exportable in-platform reports, our campaign dashboards provide a visualization of your campaign's performance, with updated data populating every 4 hours. Key metrics, including spend, impressions, CTR, and CPA can be viewed and cross-referenced. The pacing bars reflect whether or not the campaign is on track to spend the budget in its entirety before the campaign's end date, offering insight into when optimizations could be made to improve performance.
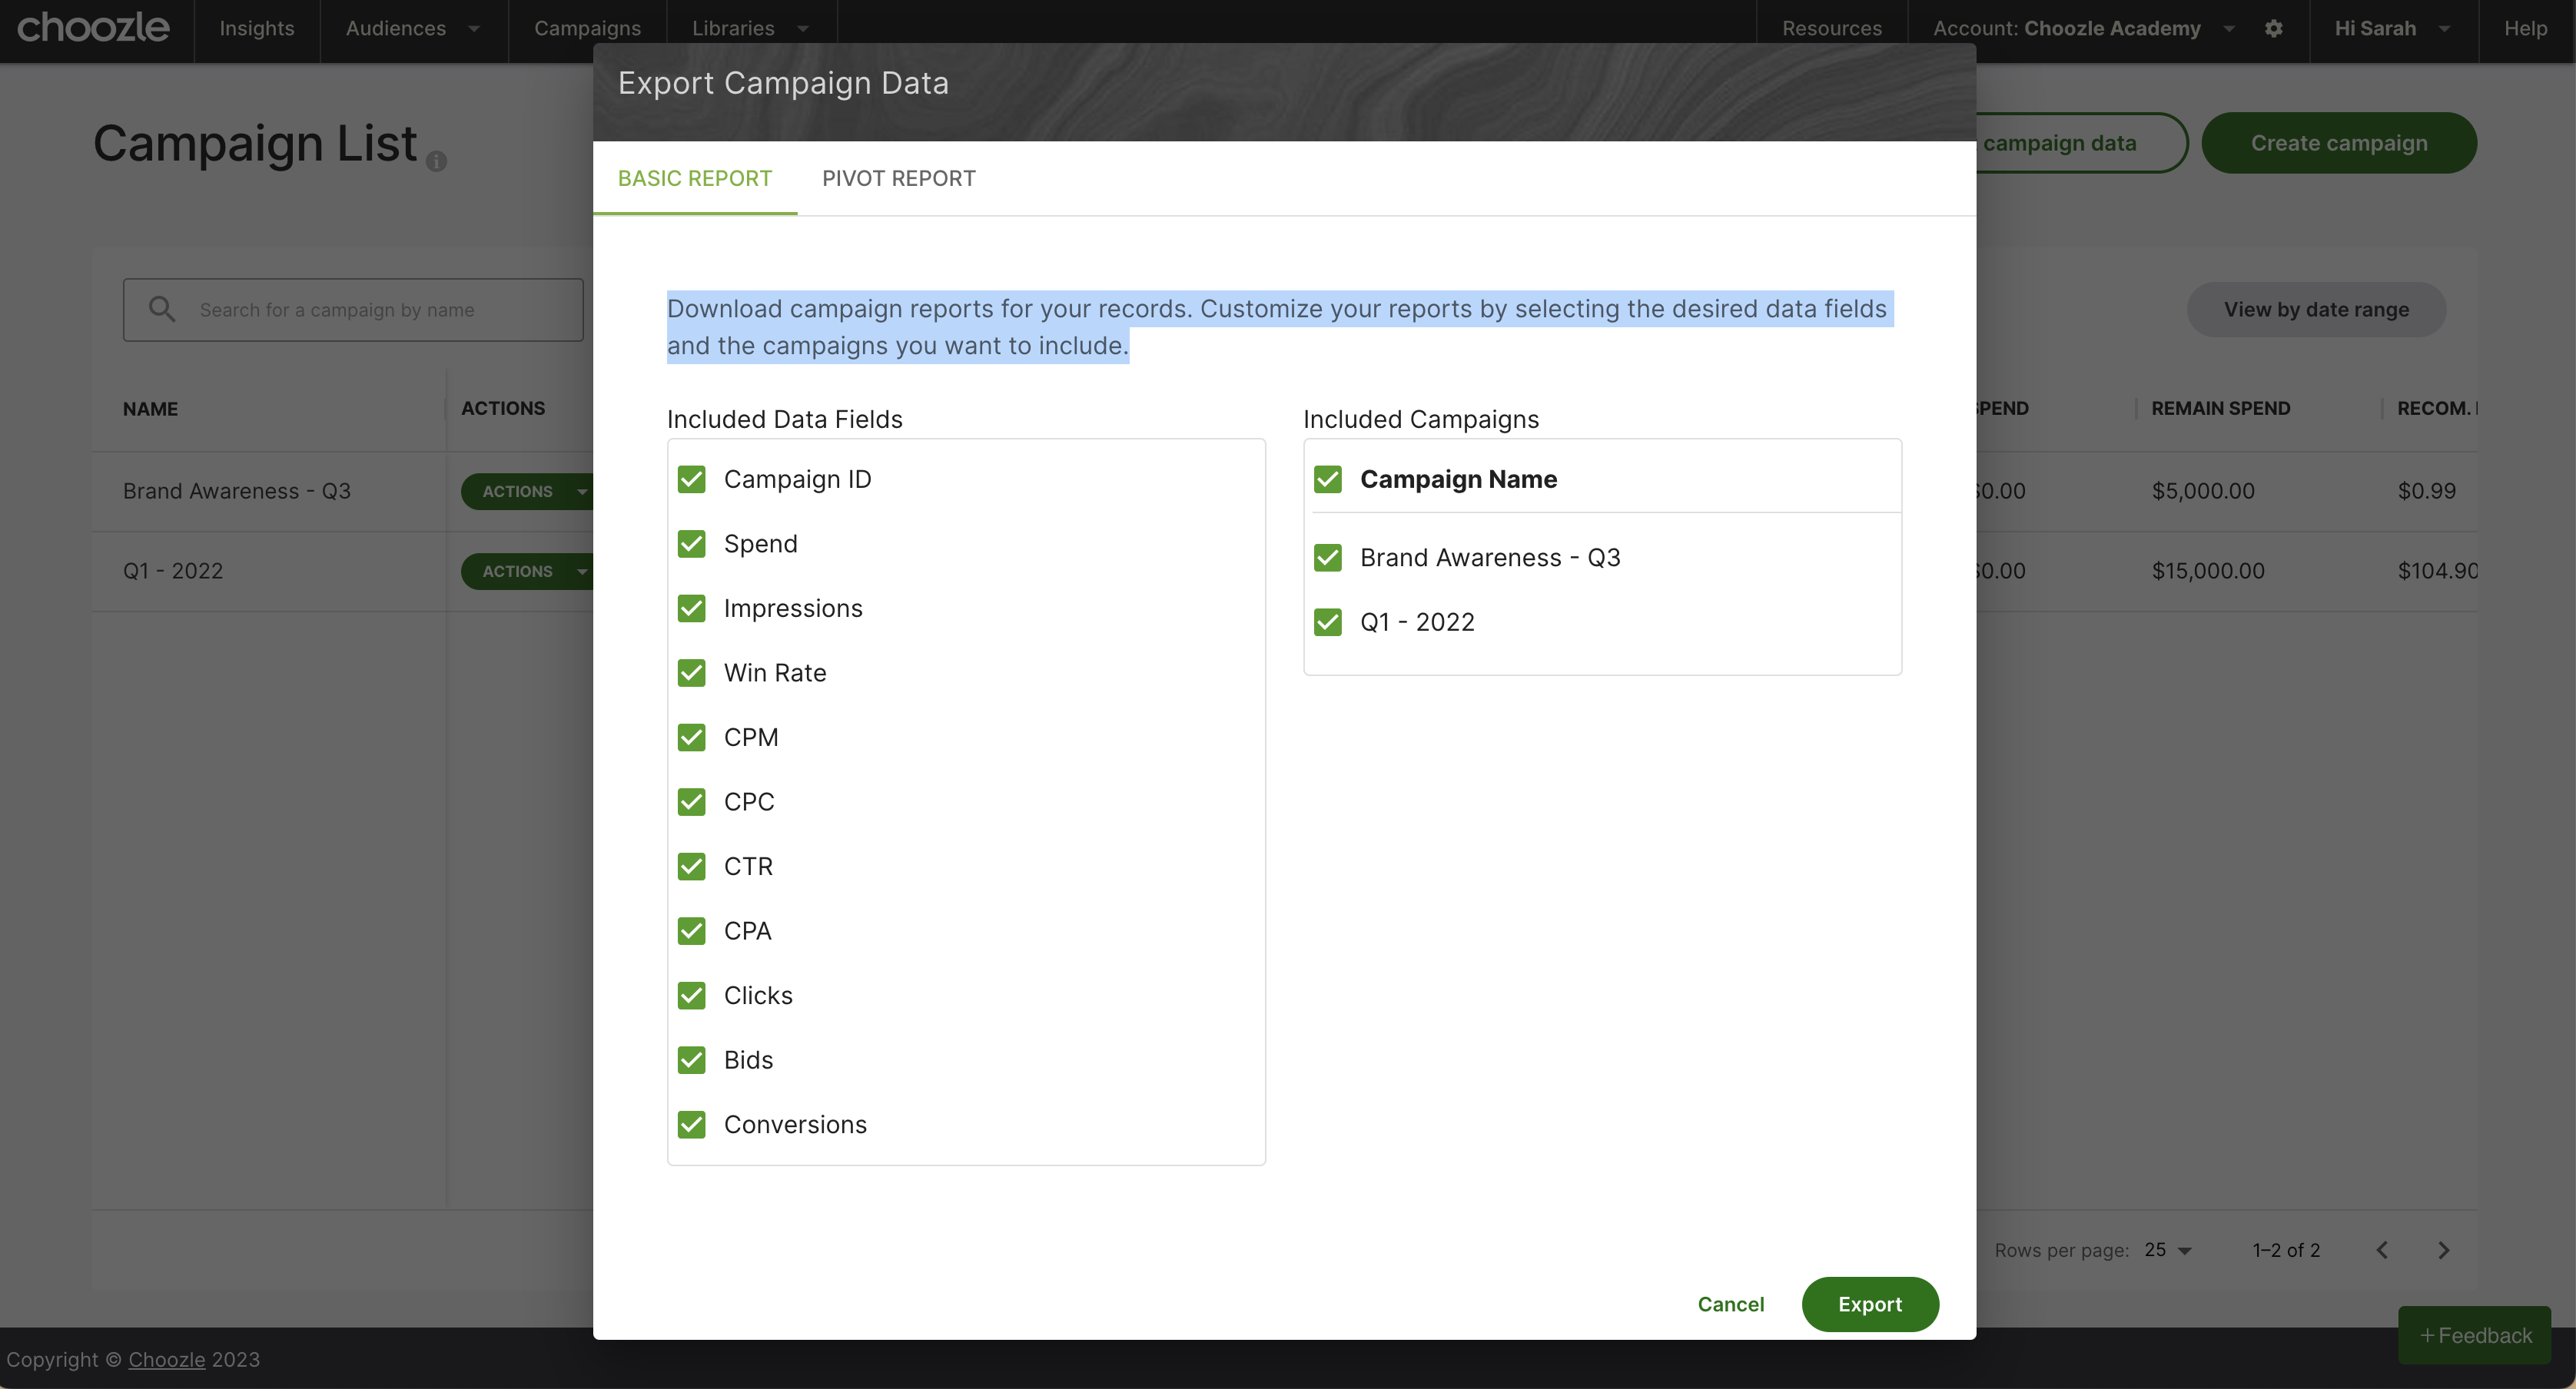
Campaign PDF Reports
After you have launched your campaign, you have the ability to download reports to show campaign progress or results. At the campaign level, select the drop-down "Export Campaign Data" button on the top right. From here, download campaign reports for your records. Customize your reports by selecting the desired data fields and the campaigns you want to include.
You can also export a PDF Margin Report. Select "View Details" from the Action drop down menu. Click PDF Margin Report. To apply an adjustment, you can select from two options. Select Margin if you'd like to apply a percentage addition to the campaign, or select Total Budget to have the system evenly distribute the remaining amount of funds across all ad groups to make your total budget reach a certain amount.
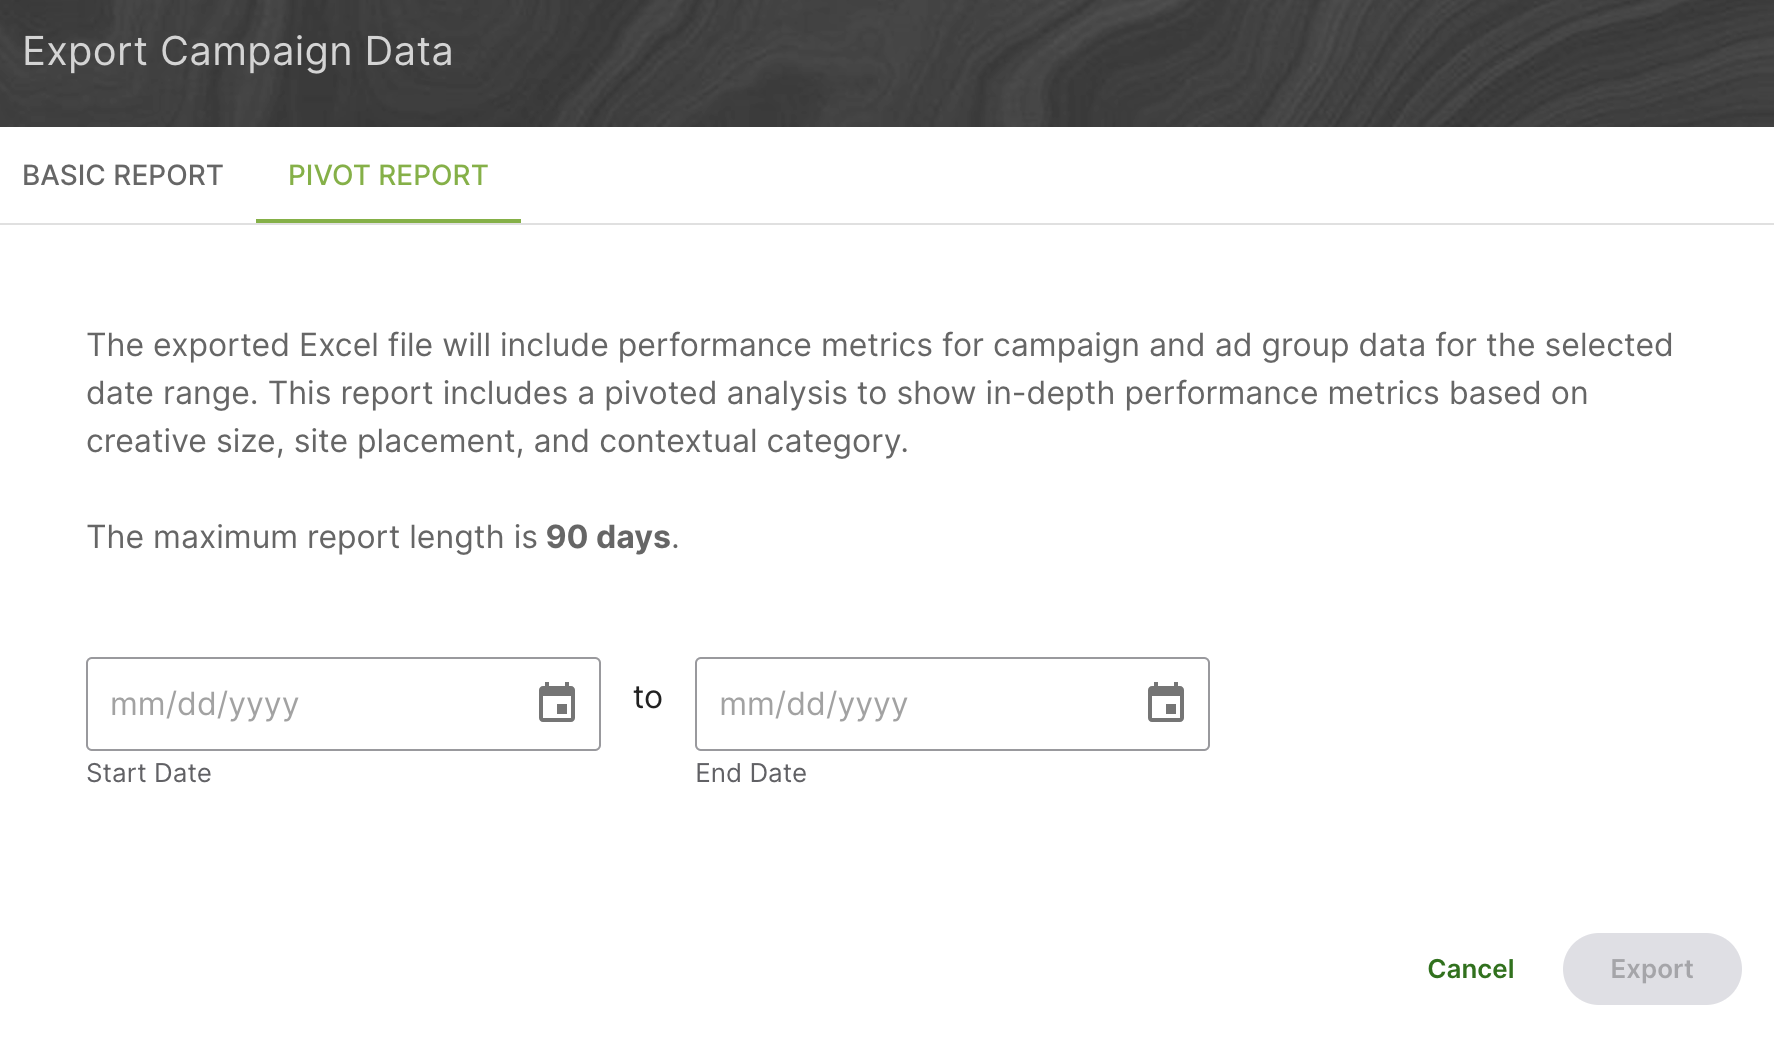
Pivot Reports
Need even more data? Click on Export Campaign Data in the campaign list view and then toggle to Pivot Reports.
Pivot reports are a pivoted analysis to show in-depth performance metrics based on the ad group, creative, site placement, ad format, contextual category, data segment, pacing, and date. Just select the date range (up to 90-days), and a detailed report will be emailed to you from help@choozle.com.
For an in-depth guide on how to use this report, please see: Pivot Reports
Need conversion-level data? The Growth Account team can also pull conversion reports manually upon request. Conversion reports will show performance for each conversion event that is set up within a campaign. To request one of these reports, please submit a ticket through the Choozle Support Center.
API Reporting
Choozle has an API for your campaign reporting data and is available for reporting tools, such as Funnel, AgencyAnalytics, NinjaCat, Growth Nirvana and TapClicks. If you are using TapClicks, you must follow these onboarding steps.
If we do not already have an integration set up with your reporting tool, please connect with our team through the Choozle Support Center to make an introduction to your third-party reporting tool contact. From there, we’ll introduce our API instructions to your contact and then the responsibility will be on their end to plug into our APIs. We will provide access to our Reporting API Documentation, which can be shared with your reporting tool's development team.
If we have an existing partnership with your reporting tool, please reach out to our team for instructions on how to build the API connection.
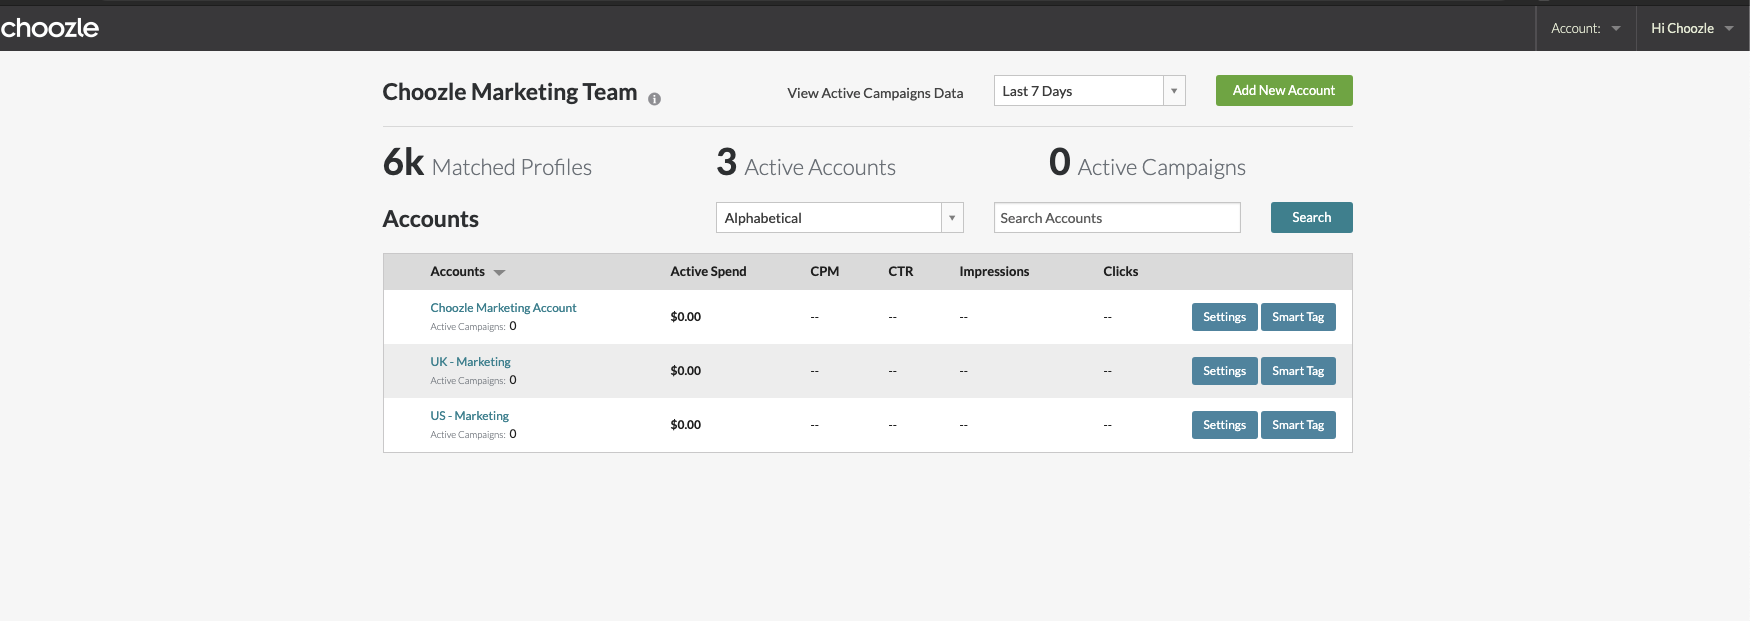
My Organization Dashboard
The "My Organization" dashboard will provide a high-level overview of all active campaigns across your advertiser accounts. You can filter the dashboard to see different intervals of data in this dashboard. The dashboard will summarize the number of active campaigns you have across your active advertiser accounts. Please note, it will not provide details on paused or canceled accounts.
Performance Graph on Ad Group Edit Form
Ad group performance data is readily accessible when editing an existing ad group, empowering users to quickly analyze and implement data-driven optimizations without leaving the page. With customizable date filters, you can control the analysis period, ensuring an efficient approach to your campaign management.
To see the performance data graph, follow these steps:
- Select a campaign
- Navigate to the “Edit Settings” tab
- Select an active ad group card
- At the top of the edit form, click “View Performance Data”
- Select the metric, and change the date range to the timeframe you want to view.
- Layer on an additional metric to review
Additional Reporting Available
Choozle offers additional reporting data accessible from the backend, available upon specific request and necessary approvals. To request a specific report, please reach out to your dedicated Account Manager or Submit a Ticket
Please provide the following information when requesting a report:
- Advertiser
- Campaign(s)
- Adgroup(s)
- Date Range
- Metrics
Depending on the size of your report it may take at minimum a few hours to generate. So we recommend allowing yourself enough time when requesting reports.
Need Help?
If you have any additional questions please reach out via your Customer Support Portal!