TABLE OF CONTENTS
Getting Started
Pivot reports provide comprehensive insights into your campaign performance. Use this guide to help interpret the data effectively. For full access to these reports, ensure you have Microsoft Excel with Pivot Table functionality enabled.
Click on Export Campaign Data in the campaign list view and then toggle to Pivot Reports. Select your desired date range for analysis, then click Export to download your data.
Pivot Reports Tabs
 TAB 1: ALL
-
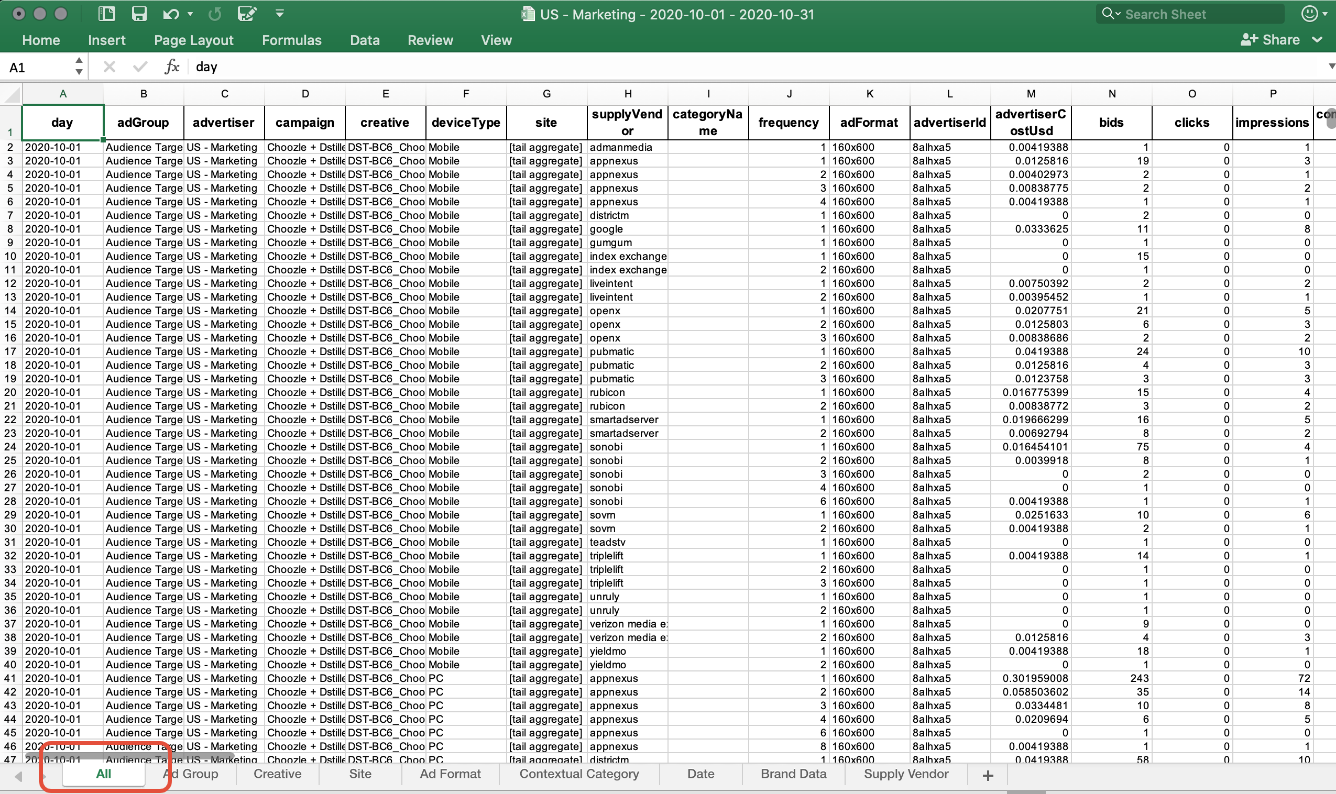
This will show you raw data from all tabs below in one (non-pivot table format) view including added metrics like fold and device type.
-
Fold: This metric indicates whether your ads appeared above or below the fold on a web page. Within the advanced settings of an ad group, you can modify bid strategies based on the ad’s position to better align with your campaign objectives.
-
Device Type: This metric identifies the device type where your ads are delivered, such as desktop, mobile, tablet, or all devices. To customize whether your ad group serves impressions to computers, mobile phones, or tablets, navigate to Ad Group > Action > Edit Ad Group. In the Edit Ad Group screen, scroll to Advanced Settings and expand the Device Type section. All device types are selected by default, but you can deselect specific devices to prevent impressions from being served to them.
-
-
This tab is useful for manually importing the raw data into third-party reporting systems. You can simply copy this tab into a new Excel sheet and then upload it from there.
 TAB 2: Ad Group Performance
-
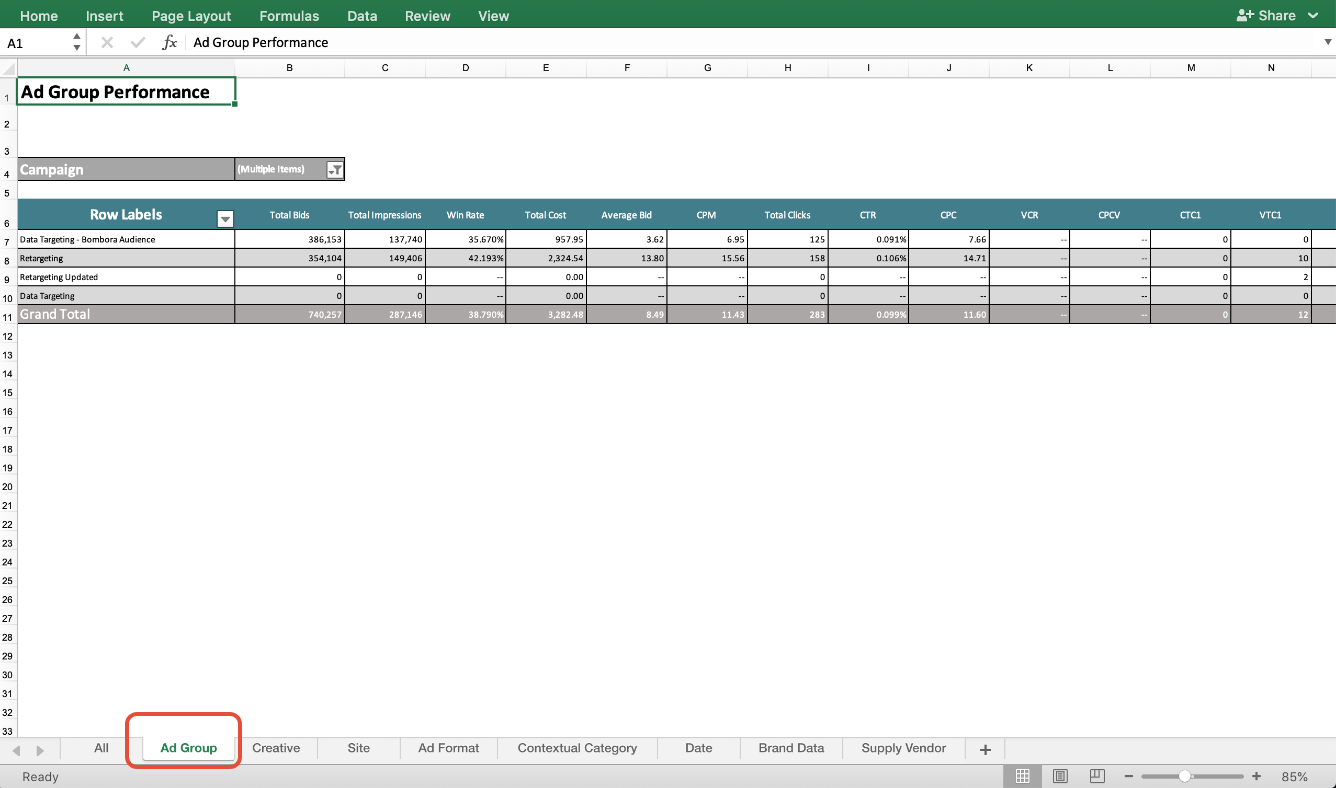
Performance-based data within each ad group is visualized. This tab will show you much of the same information you can find in the Choozle dashboard with the added benefit of seeing your average bid for each impression.
-
One option for optimization includes reallocating the budget to the higher-performing ad group(s).
- Conversion details are listed after the cost-per-click (CPC) metric:
- CTC: Click-through conversions meaning a user clicked on your ad and converted on your webpage upon the first visit.
- VTC: View-through conversions meaning a user clicked on your ad, left your page without immediately converting, but came back to your page within the attribution window and converted at a later time.
- TC: Total conversions whether view-through or click-through.
- The number corresponds to the order in which your conversion events are listed at the campaign level. If you have more than five conversion events, the pivot report will only include the first five conversion events. Use the Detailed Reports for data on all 25 conversion events.
 TAB 3: Creative
-
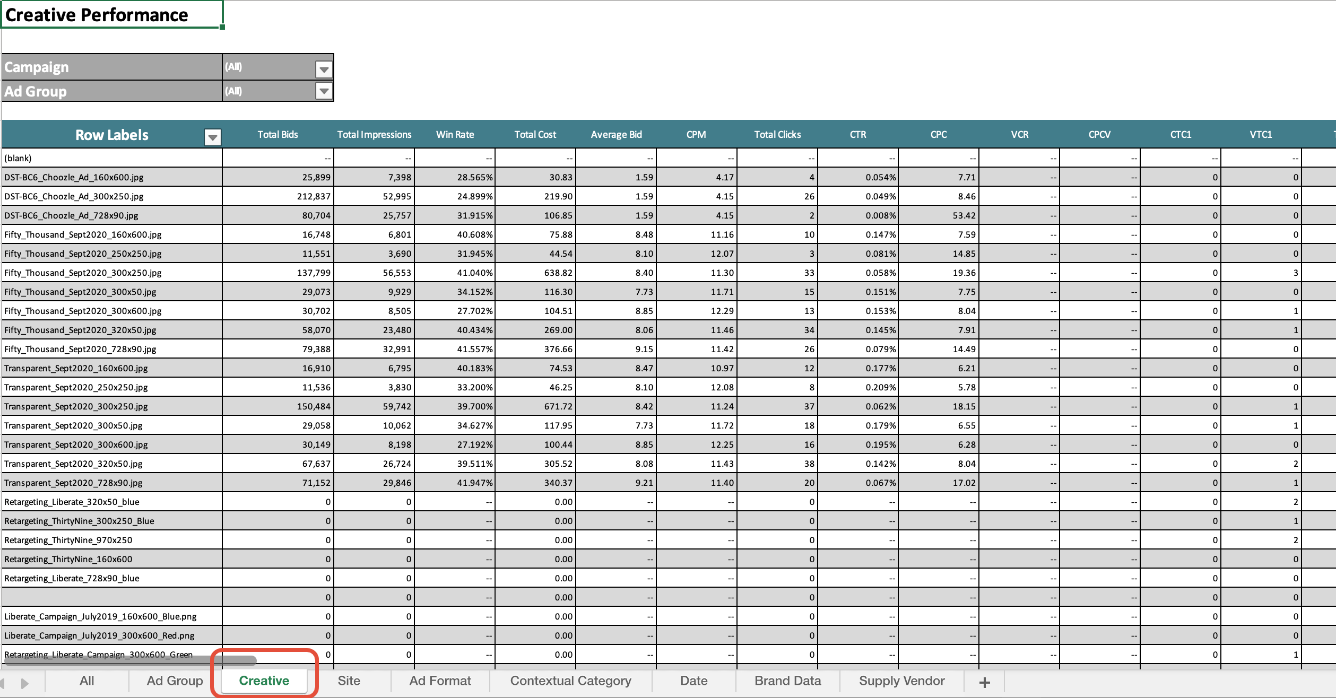
This tab breaks down performance by creative. Compare impressions to clicks to see which assets drive the most engagement (CTR). It also lists total bids and average bid, so you can gauge which sizes are most popular and how competitive the inventory is.
-
Look for trends in individual creative performance and remove poor-performing creatives.
TAB 4: Site
-
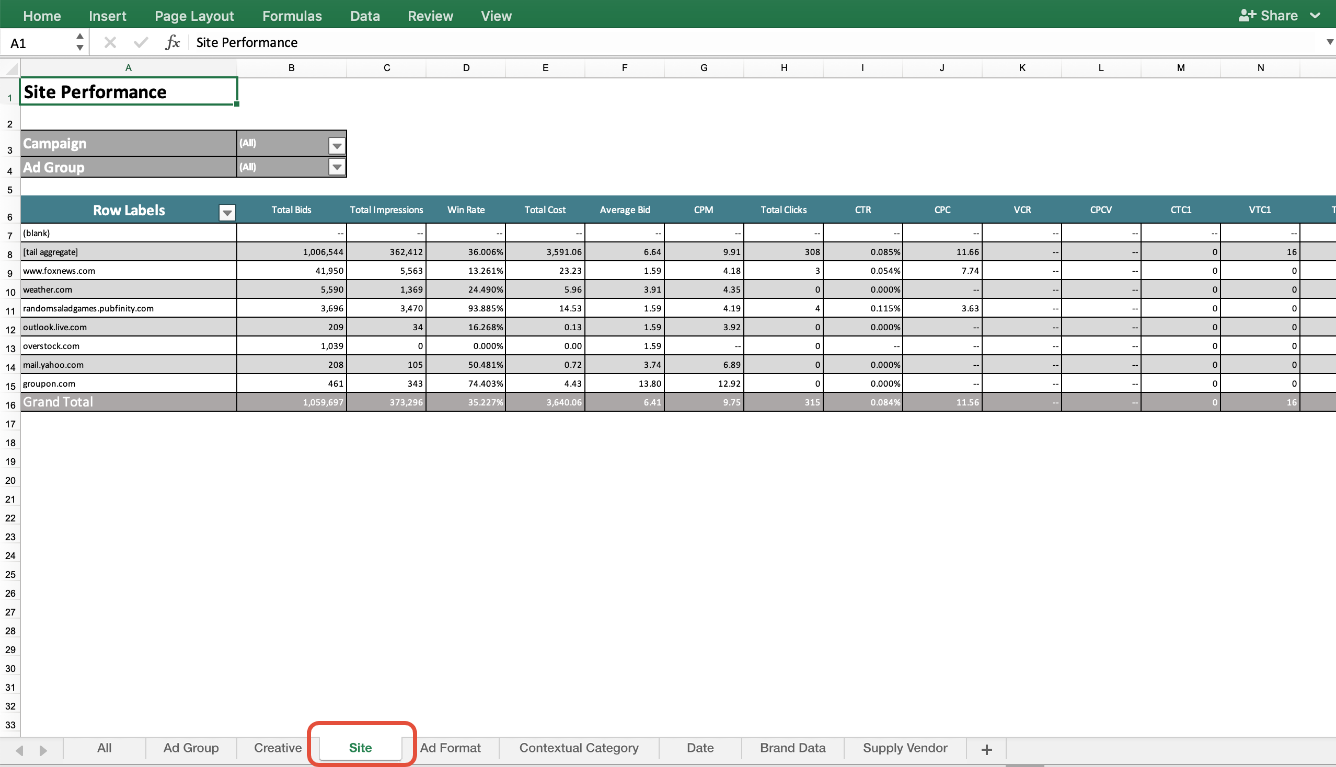
This tab will show a list of websites where ads have appeared. Seeing what inventory you have served impressions on and the consequent clicks garnished from each impression will give you a good idea of what sites are cohesive for your brand.
-
Determine possible blocklists or whitelists by eliminating at-scale options with no clicks.
-
Create a blocklist for poor-performing sites, and/or
-
Create a whitelist of high-performing sites and consider a bid adjustment for higher-performing sites.
-
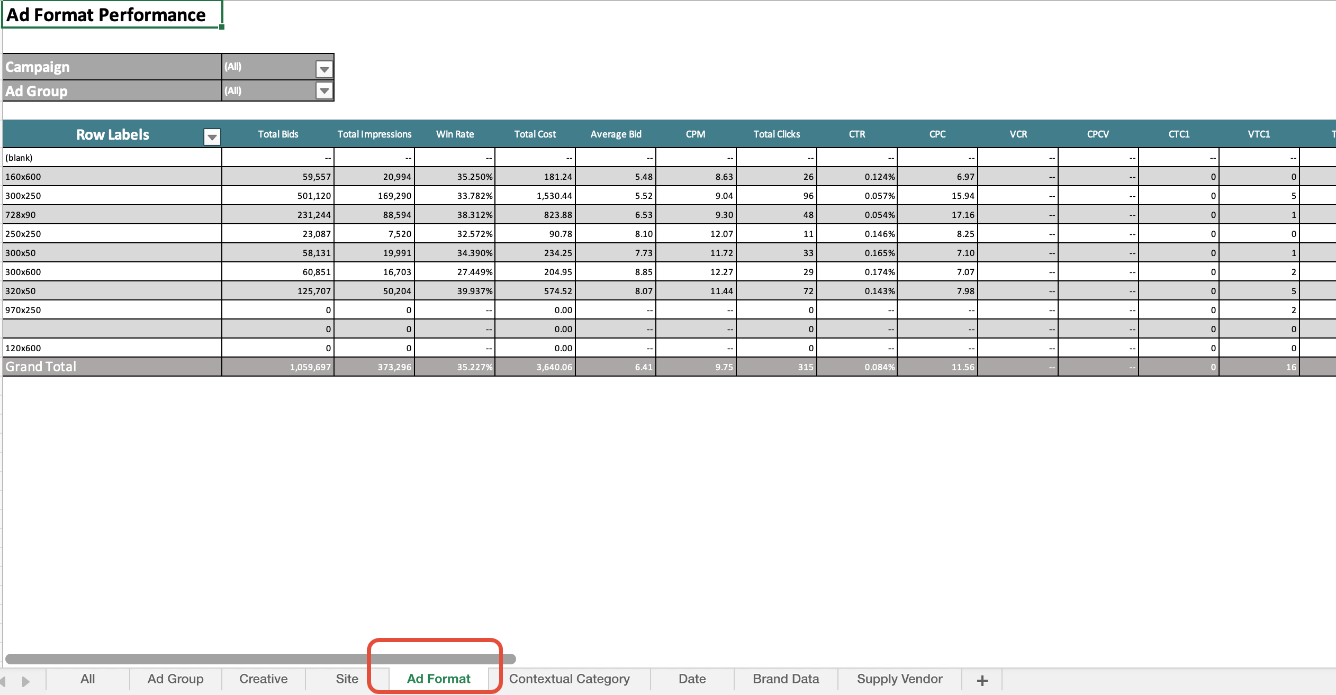
TAB 5: Ad Format
-
This tab breaks out creative performance by the size of the creative asset. The number of bids will show the variance in inventory for each size.
-
See attached creative specifications sheet for top-performing creative asset sizes.
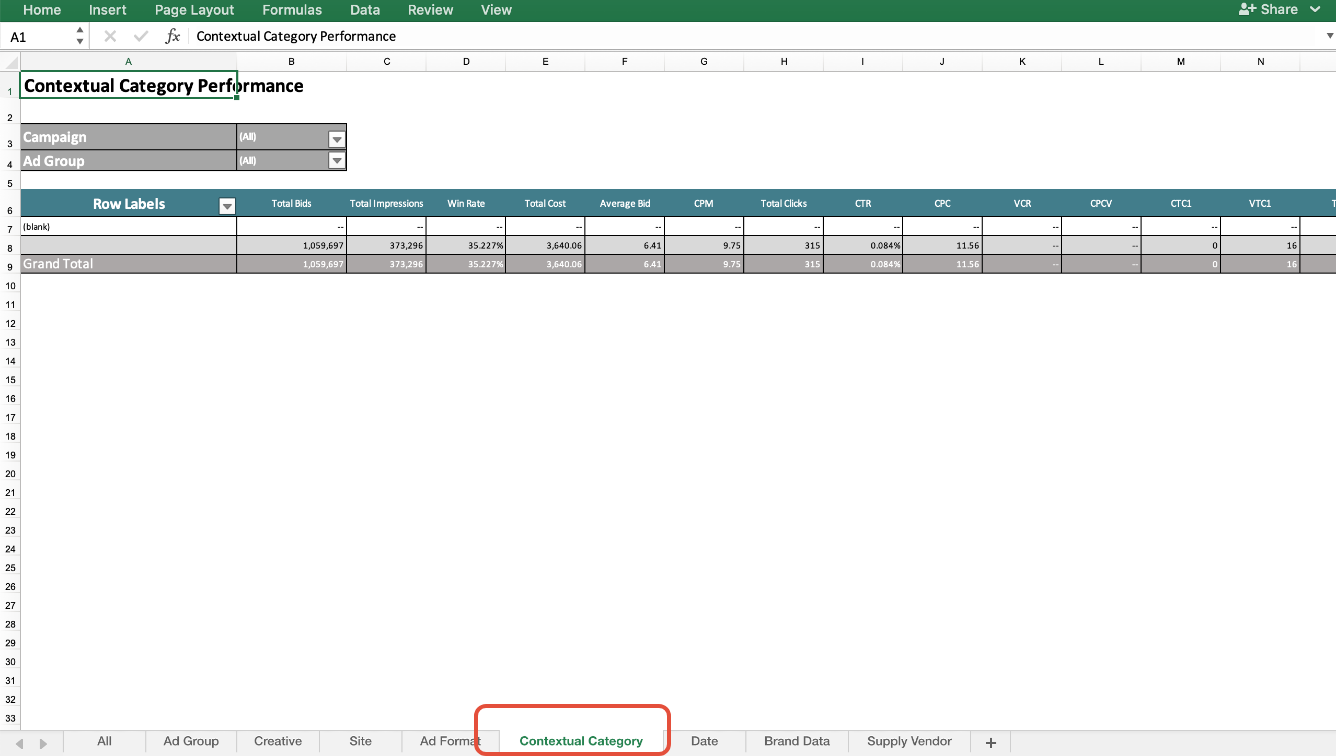
TAB 6: Contextual Category (if using contextual category targeting)
-
This tab will only show data if you are employing contextual category targeting at the ad group level.
-
If you are using categories, you will see a list of publisher-defined categories of sites where ads have appeared. For example, “food and drink,” or “women’s health.”
-
Include or exclude categories in an ad group based on category performance.
-
Remember to adjust the order of categories, as they are targeted in the order in which they are listed in your ad group setup.
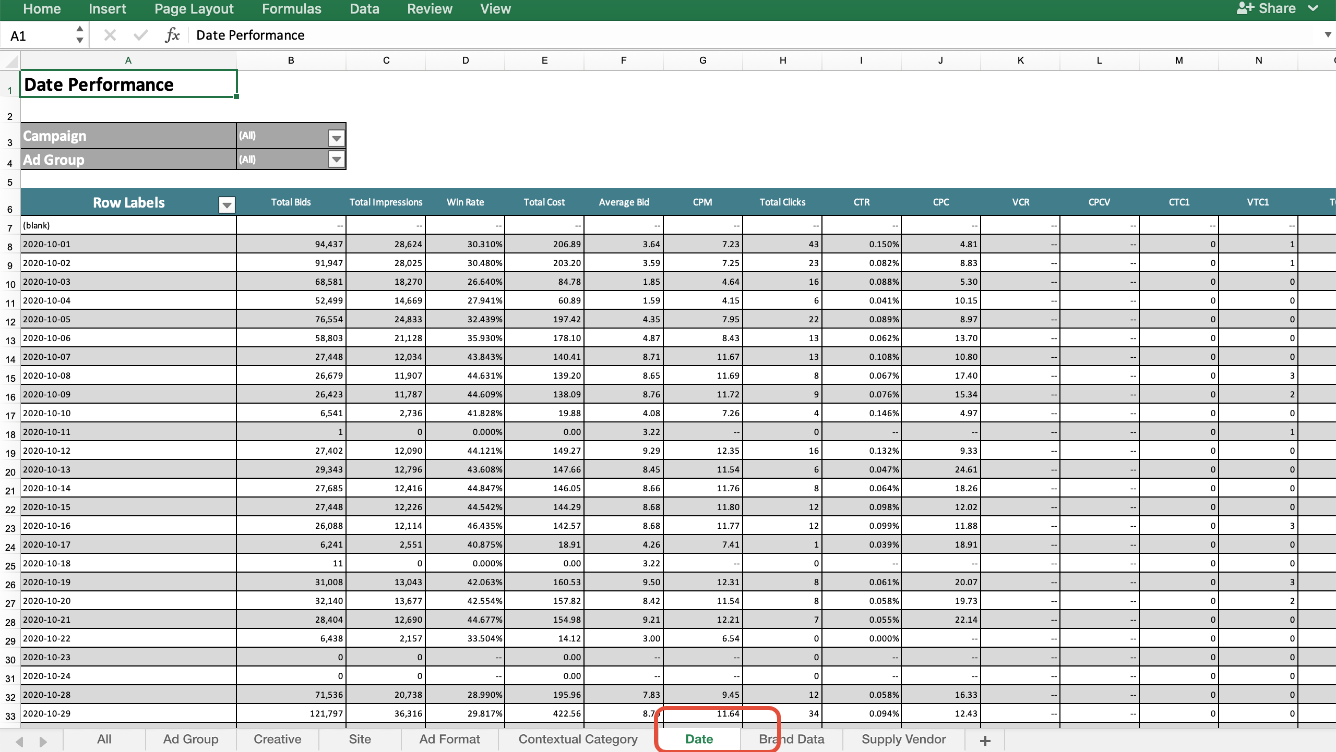
TAB 7: Date
-
View campaign performance by the date of impression delivery.
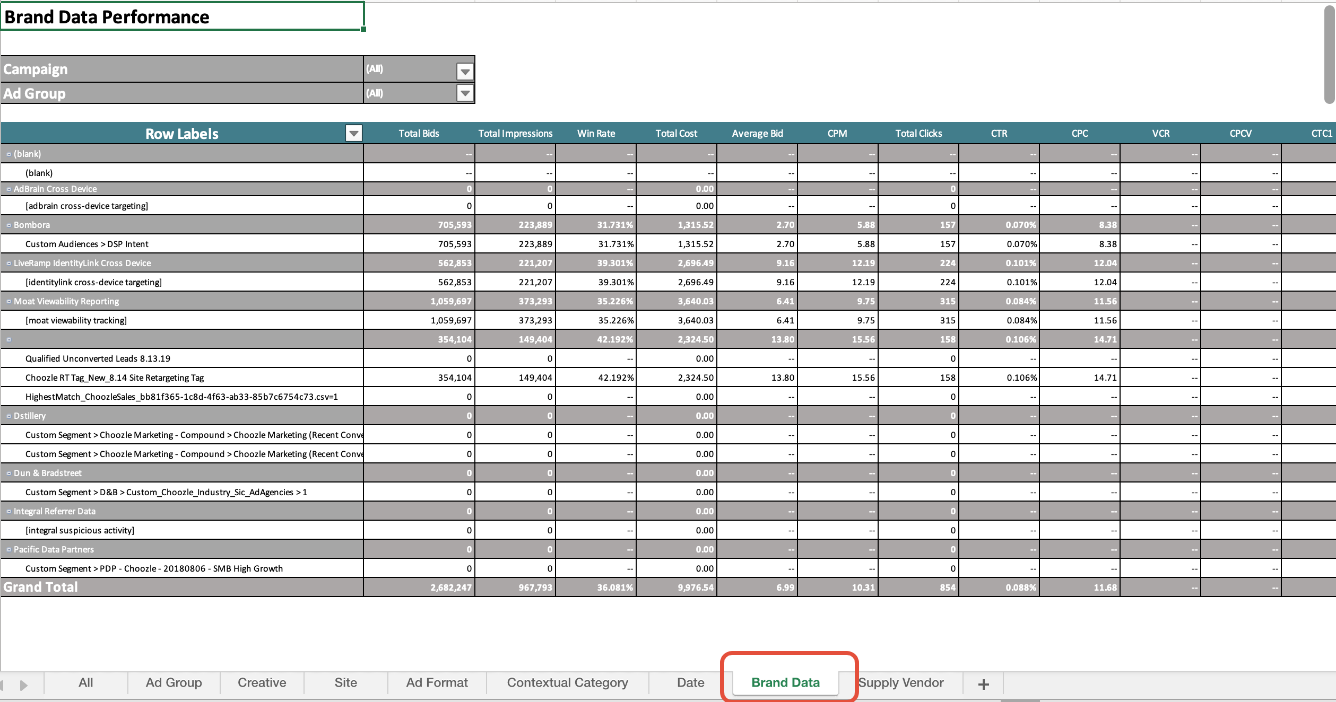
TAB 8: Brand Data (if using data targeting)
-
This tab breaks out impression delivery by data segment in the custom audience applied to each ad group.
-
Include or exclude data brands in a custom audience based on data segment performance.
-
Adjust the order of data brands, as they are targeted in the order in which they are listed in your custom audience.
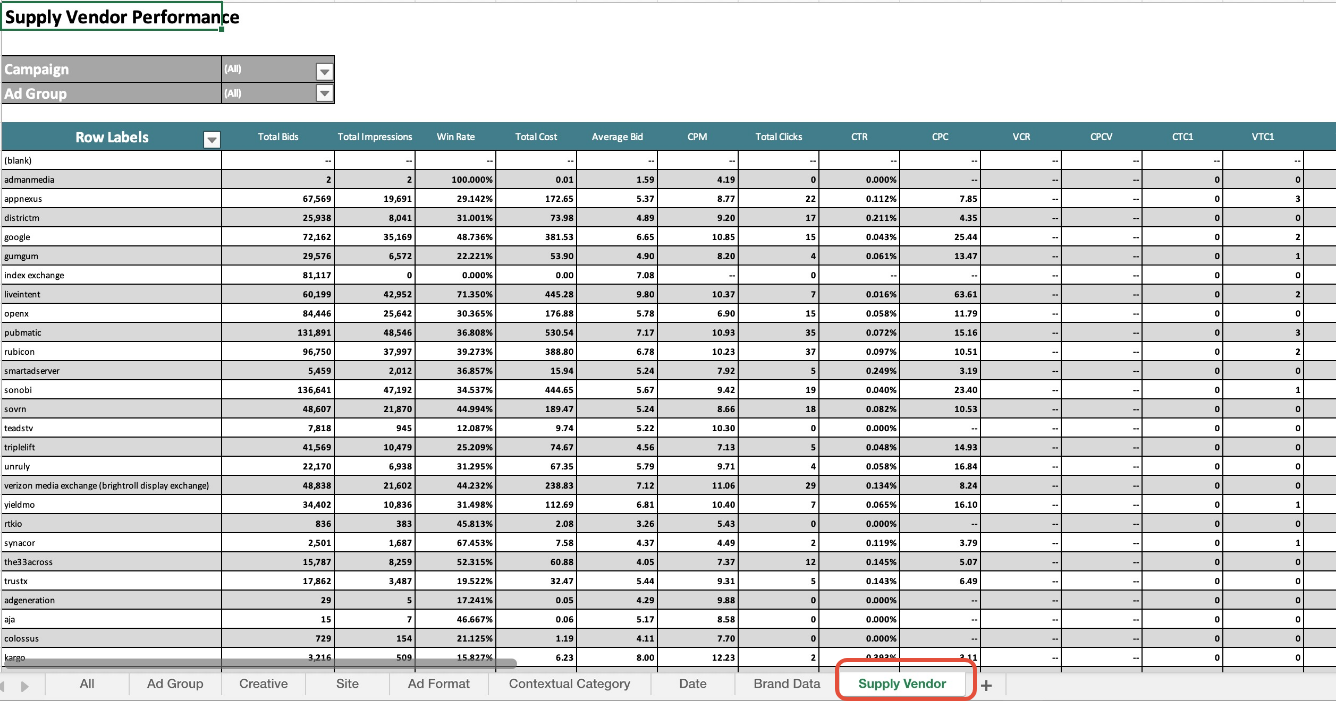
TAB 9: Supply Vendor
-
This tab breaks out impression delivery by supply vendor
-
Include or exclude supply vendors in the advanced settings based on performance.
Understand Terms in the Pivot Reports
Tail Aggregate: The Tail Aggregate” groups all sites with 200 or fewer impressions. When a site exceeds 200 impressions, it breaks out into its own line item. We combine these long-tail sites into one line item because there can be thousands of them, which would make optimization unwieldy. Early in a campaign, you may see only the Tail Aggregate if no single site has reached 200 impressions yet. If you need a detailed breakdown, contact your Account Manager or Submit a Ticket with our support team.
Understanding Site-Not-Provided: "Site-Not-Provided" is a phrase used when the publisher does not want their domain name shown in RTB reports. We frequently see "Site-Not-Provided" shown when higher-profile websites do not want their domain shown on the RTB reports, so brands may continue to buy ad placements directly from them.
Numbers: Numbers in your pivot report, listed under Sites, are often the ID numbers for apps. Run a quick Google search of the number, and you'll usually be able to identify the application.
Current Limitations
Currently, you will not be able to view connected TV and other PMP deal performance in the pivot reports.
Need Help?
If you have any additional questions please reach out via your Customer Support Portal!
