GUIDE
- Overview
- Key Benefits
- How to Access
- Scheduling Reports
- Alerts
- Available Data Points
- Highlights of Available Data Points
- Frequently Asked Questions
Overview
The demand for marketers to showcase campaign performance is higher than ever, and Choozle is meeting this demand with the Detailed Reports feature. Detailed Reports provides more and deeper data in real-time, removing the need to download Excel documents for comprehensive data. Detailed Reports provides expanded reporting across many key data points, such as creative, sites, geolocation, browser, device type, etc that streamline campaign optimization.
Key Benefits
- Real-time and in-depth data for streamlined optimizations
- Easy to digest data tiles in a variety of visualization formats
- New data points negate the need to request customized reports, including Geolocation Insights, Site Tail Aggregate, Creative Performance, and more
- The new scheduling feature allows you to automate CSV or PDF reports to be sent to your email
- Conversions 6-25 will be included in all data for CPA and conversion counts
- No limitation on the date range for exporting campaign data
How to Access
- Navigate to the Campaigns Tab and click the "Actions" dropdown menu. Select "View Details".

- Click the “Detailed Reporting” option.

- The Detailed Reporting view will automatically populate within the dashboard.
Scheduling Reports
-
Navigate to and click the three vertical dots in the right-hand corner of the dashboard and select “Schedule delivery”.'

-
Select the cadence and time for which you’d like this report sent.
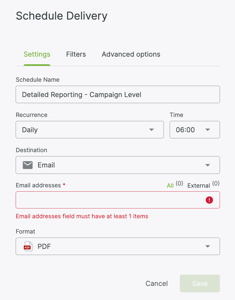
- Input the email recipients.
- Select the desired file format - PDF, CSV, or PNG
- Click “Save”.
Alerts
- Navigate to the tile for the metric you’d like to receive reports for, and you will see the “Alerts” icon pop up.
- Click the “Alerts” icon and give the alert a name.
- You will then select the condition from the drop-down. Your options are “Is greater than”, “Is less than”, “Is equal to”, “ Is greater than or equal to”, “Is less than or equal to”, “Increases by”, “Decreases by” and lastly, “Changes by”.
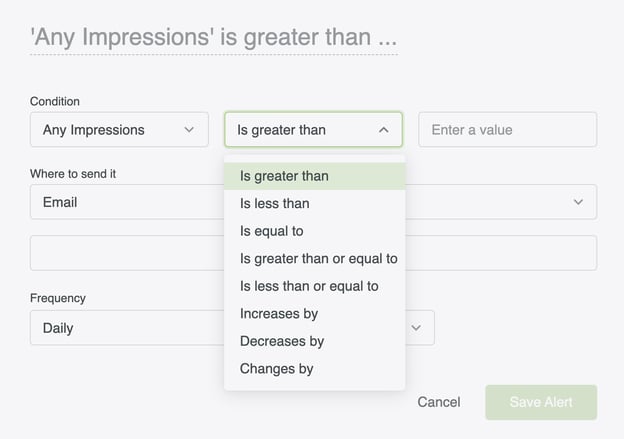
- Then, you will enter the desired value.
- Next, you will input the email address(es) to which you would like the report sent.
- Then, you will select the frequency and time this alert will be sent out. Your options for frequency are monthly, weekly, daily, hourly, or by the minute. For time, you can select ten-minute increments at any point in the day.
- Lastly, you will click “Save Alert”.
Available Data Points
|
Campaign Overview |
|
|
|
Campaign Details |
|
|
|
Ad Group Overview |
|
|
|
Ad Group Details |
|
|
Highlights of Available Data Points
Top Performing Sites
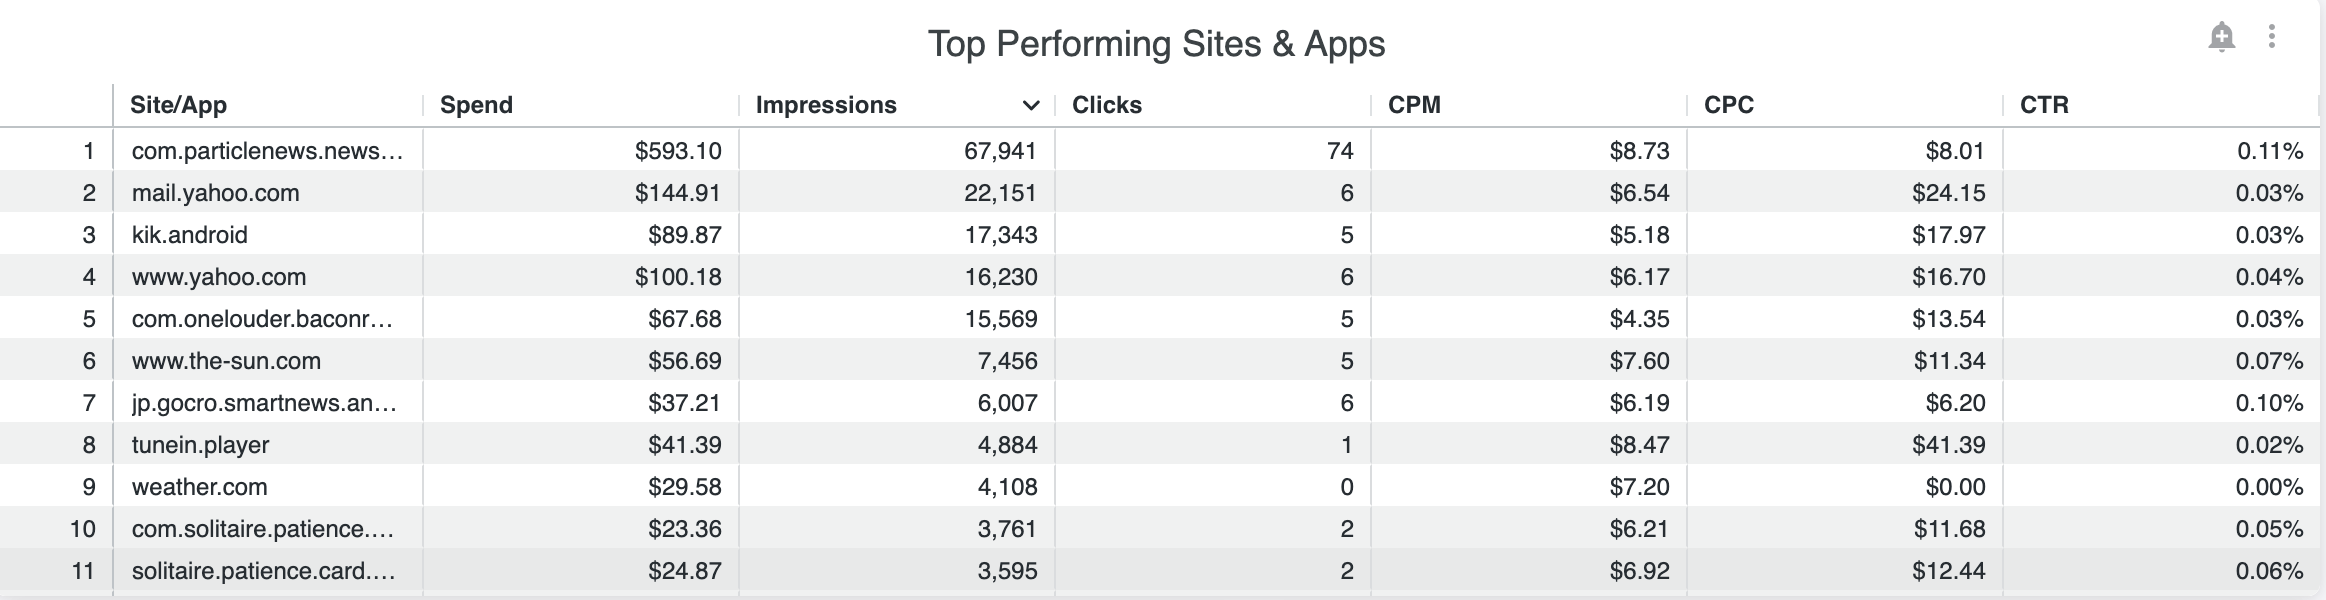
On campaign and ad group reports, users will be able to view the top-performing sites by Spend, Bids, Impressions, Clicks, and Conversions. The Top Performing Sites report will show all websites where ads have appeared with a limit of 5,000 rows. If you wish to see more than 5,000 rows of data, you can download the report and select all data from the advanced settings. The Top Performing Sites report limits the need to request the Tail Aggregate report from the support center.
Seeing what inventory you have served impressions on and the consequent clicks garnished from each impression will give you a good idea of what sites are cohesive for your strategy. Having a report of all websites where ads have appeared will allow you to determine possible blocklists or preferred lists by optimizing towards websites that show better performance, such as sites where you’ve earned a lot of impressions but have gained zero clicks. Users can create a blocklist for poor-performing sites by sorting the report by clicks or conversions. Or create a preferred list of high-performing sites by adding a bid adjustment for sites that result in better performance.
You might see a number instead of a .com site within the report. These are often the ID numbers for apps. Run a quick Google search of the number, and you'll usually be able to identify the mobile application.
Top Performing Private Marketplace Deals
On campaign and ad group reports, users will be able to view the top-performing private marketplace deals by Spend, Bids, Impressions, Clicks, and Conversions. The Top Performing Private Marketplace Deals report will display performance metrics on the private marketplace deals across display, video, connected tv, and audio that you’ve used within your campaign and ad groups. This report will only show individual private marketplace deals performance and not contract group performance.
Top Performing Creatives
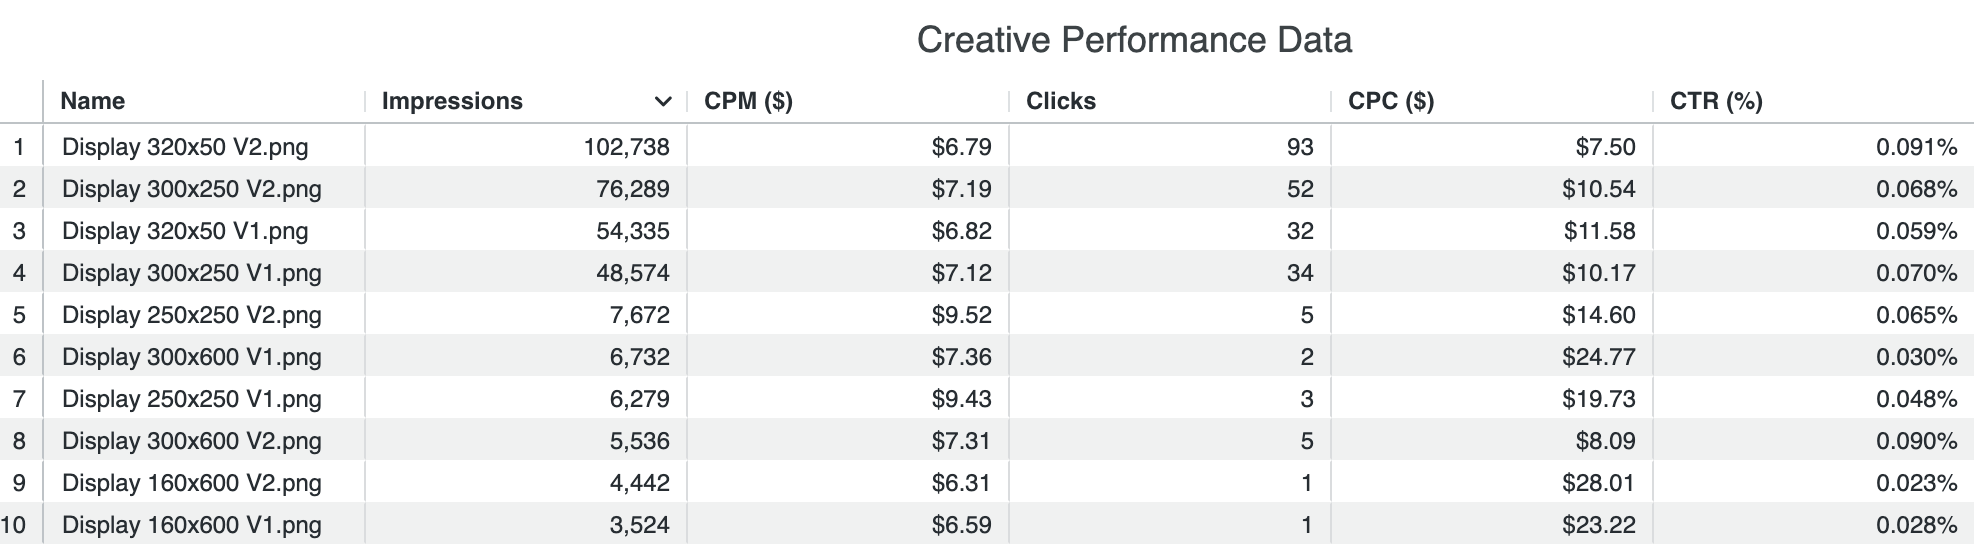
On campaign and ad group reports, users will be able to see the performance of their creative assets based on CTR and Clicks. By hovering over the chart, you can see the specific name of the creative asset and performance.
Within the chart, there is a trend line of click-through rate (CTR) across all your creative assets. This should give you a quick understanding of what creative assets are performing better than others.
Conversions by Creative Sizing
Creative size can have a big impact on the performance of your campaigns. On campaign and ad group reports, users will be able to view which creative sizes are having the biggest impact on generating conversions. This report can help you understand and optimize towards the highest-performing creative assets.
View this knowledge base article to better understand the creative sizes and formats (https://help.choozle.com/creative-assets-sizes-and-formats).
Top Performing Geolocation by Impressions, Top Performing Geolocation by Clicks, and Top Performing Postal Codes
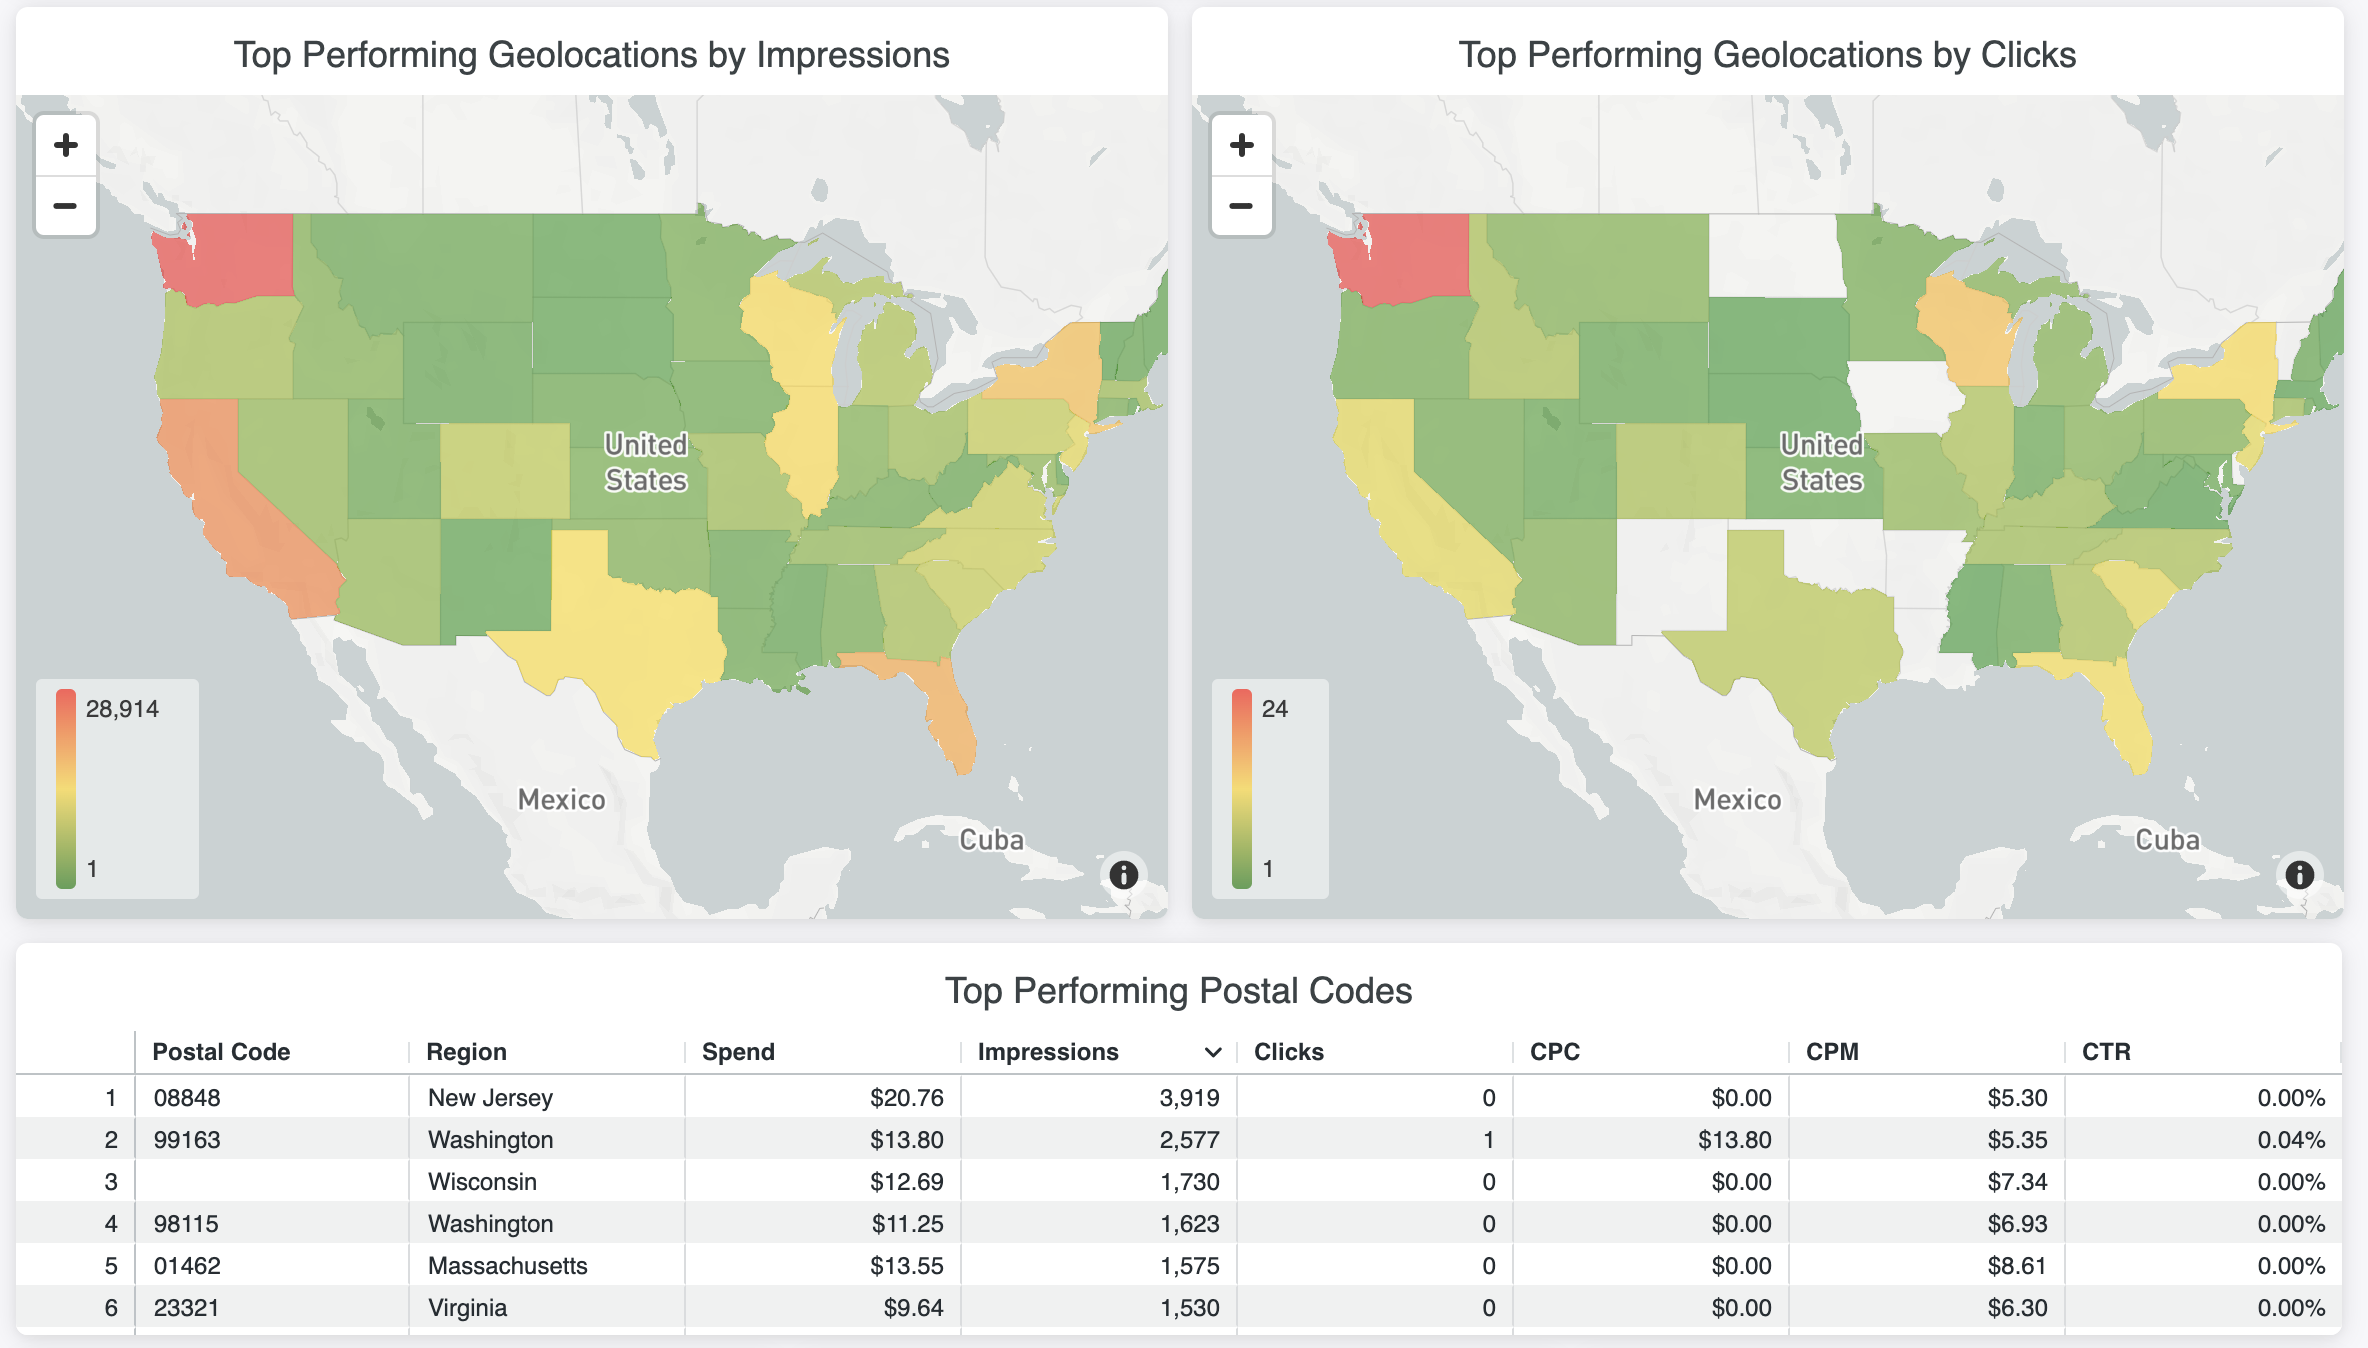
Geolocation is a required component of all campaigns within Choozle and is set at the ad group level. Users have the option to target all countries, states/provinces/regions, and cities/DMAs or use postal code lists.
On campaign and ad group reports, users will be able to view the performance of geolocations by impressions and clicks within a heatmap. Red will indicate the most impressions or clicks while green will indicate the least. These maps will default to the lower 49 states with the option to zoom out to view Alaska and Hawaii. At this time, geolocations outside the United States will not display within the heat maps of Top Performing Geolocation by Impressions and Top Performing Geolocation by Clicks charts.
In addition to the heatmaps, users have the option to view the top performing Postal Codes by Spend, Bids, Impressions, Clicks, and Conversions.
Impressions, Clicks, and CTR by Device
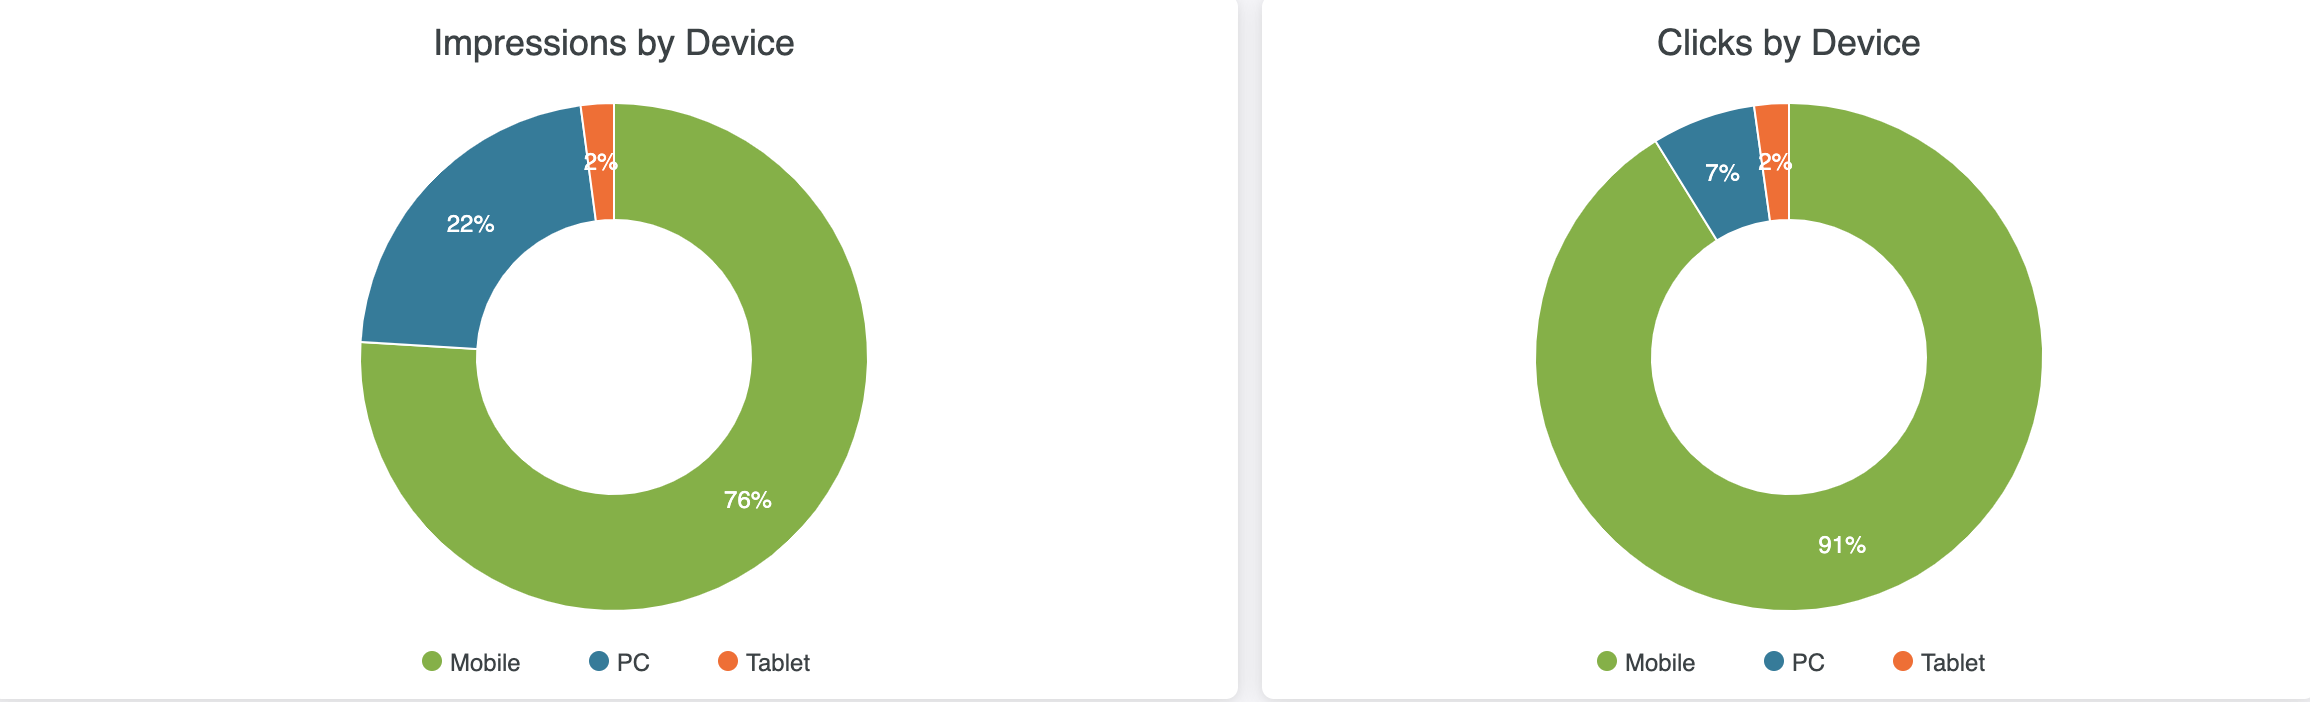
Optimizing your campaign and ad groups across all devices is key to driving user engagement and conversions. On campaign and ad group reports, users will be able to view the performance of devices by impressions, clicks and, CTR.
Important to note, if you are only targeting one device type within your campaign strategy the charts will only display one option.
Frequently Asked Questions
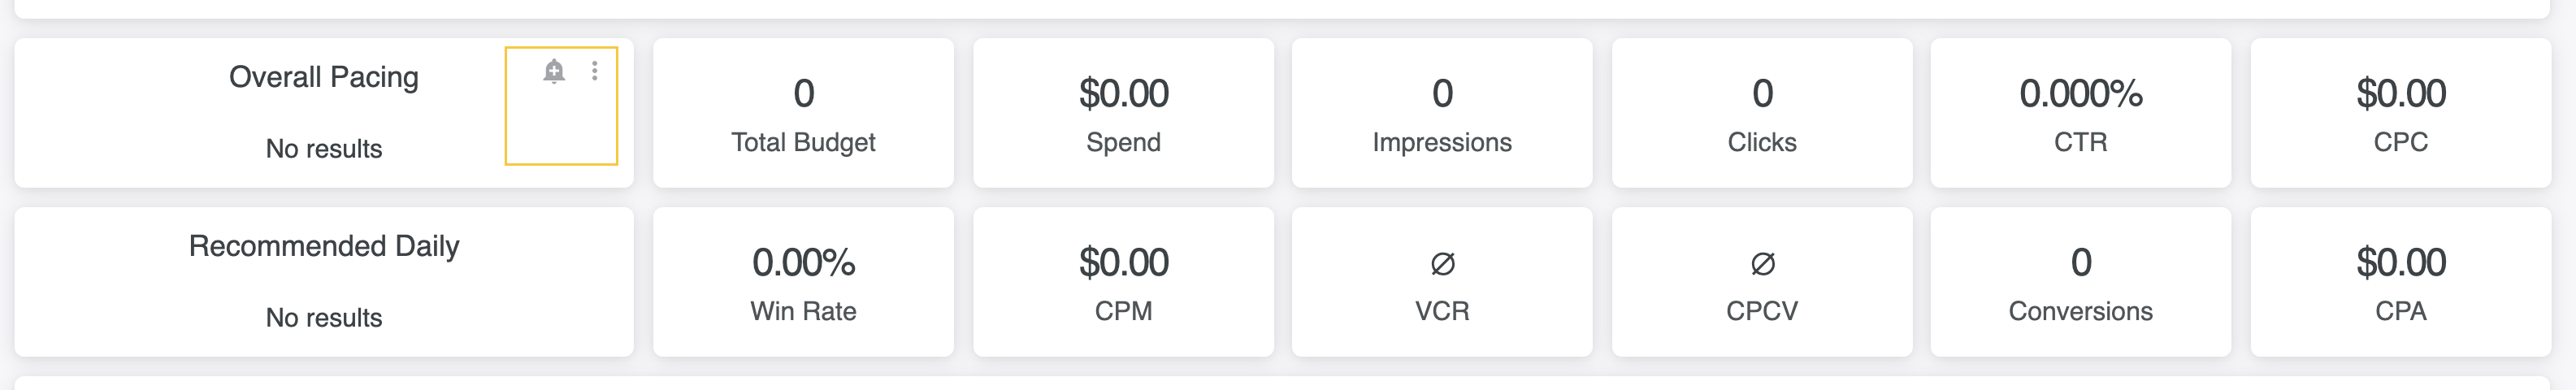
- What does it mean when a report shows [“No Results”]?
- Within detailed reports, if an individual report shows [“No Results”] this means that your campaign or ad group is not using this specific tactic or strategy.
-
In the Browser report, what does “webview” mean?
-
Webview is an open browser within an application. For example, if you open up a browser within a mobile application.
-
-
How can I use these reports to make better optimization decisions?
-
Detailed Reports can quickly and easily inform optimization decisions for your campaigns. Instead of waiting for bulk, detailed reports to download, users can now toggle between the Campaigns Dashboard and the Detailed Reporting for in-depth, real-time data. Users can see data from top-performing website lists, geolocation heat maps, creative performance bar graphs, and more.
-
-
What is the difference between these reports and the downloaded detailed reports?
- There will be some overlap in data between the downloadable detailed reports and the Detailed Reports, but the Detailed Reports are in real-time, whereas detailed reports do not include day-of data. Users must wait until midnight UTC to export campaign data from the Choozle dashboard. Additionally, Detailed Reports include easy-to-digest data tiles in a variety of formats and detailed reports are formatted in pivot tables which can be difficult to navigate, filter, and manipulate. Moreover, if exporting data is desired, Detailed Reports can be scheduled for delivery to a user’s email on a self-service basis where users formerly have had to reach out to the Customer Portal to have reports scheduled for delivery. Detailed reports will only include data on the first 5 conversion events listed at the campaign level while the Detailed Reports will include data on all 25 conversion events.
- How frequently are Detailed Reports updated?
- Most of the data will be updated within 20 minutes in real time. Some metrics, including conversions, will be 2-3 hours behind and may experience delays of up to 8 hours during downtimes.
Need Help?
If you have any additional questions please reach out via your Customer Support Portal!